1. Indoor Microgrid Experimental Setup.
The lab-scale test system is equipped with real elements and emulators for real-time measurement and monitoring of current and voltage from the photovoltaic system, direct-drive wind energy conversion system, battery storage, and DC load, representing a possible microgrid installed in remote residential areas. Furthermore, the setup is equipped with high-precision measurement devices and a data acquisition system, that incorporates a highly precise logging sample time of 1s. This short duration necessitates supervisory monitoring of dynamic system behavior, capturing all response events subject to changes in load and generation resources in real-time operation. The experimental system is used to validate the developed simulation models by applying the outdoor weather conditions.The connection schematic is detailed below;
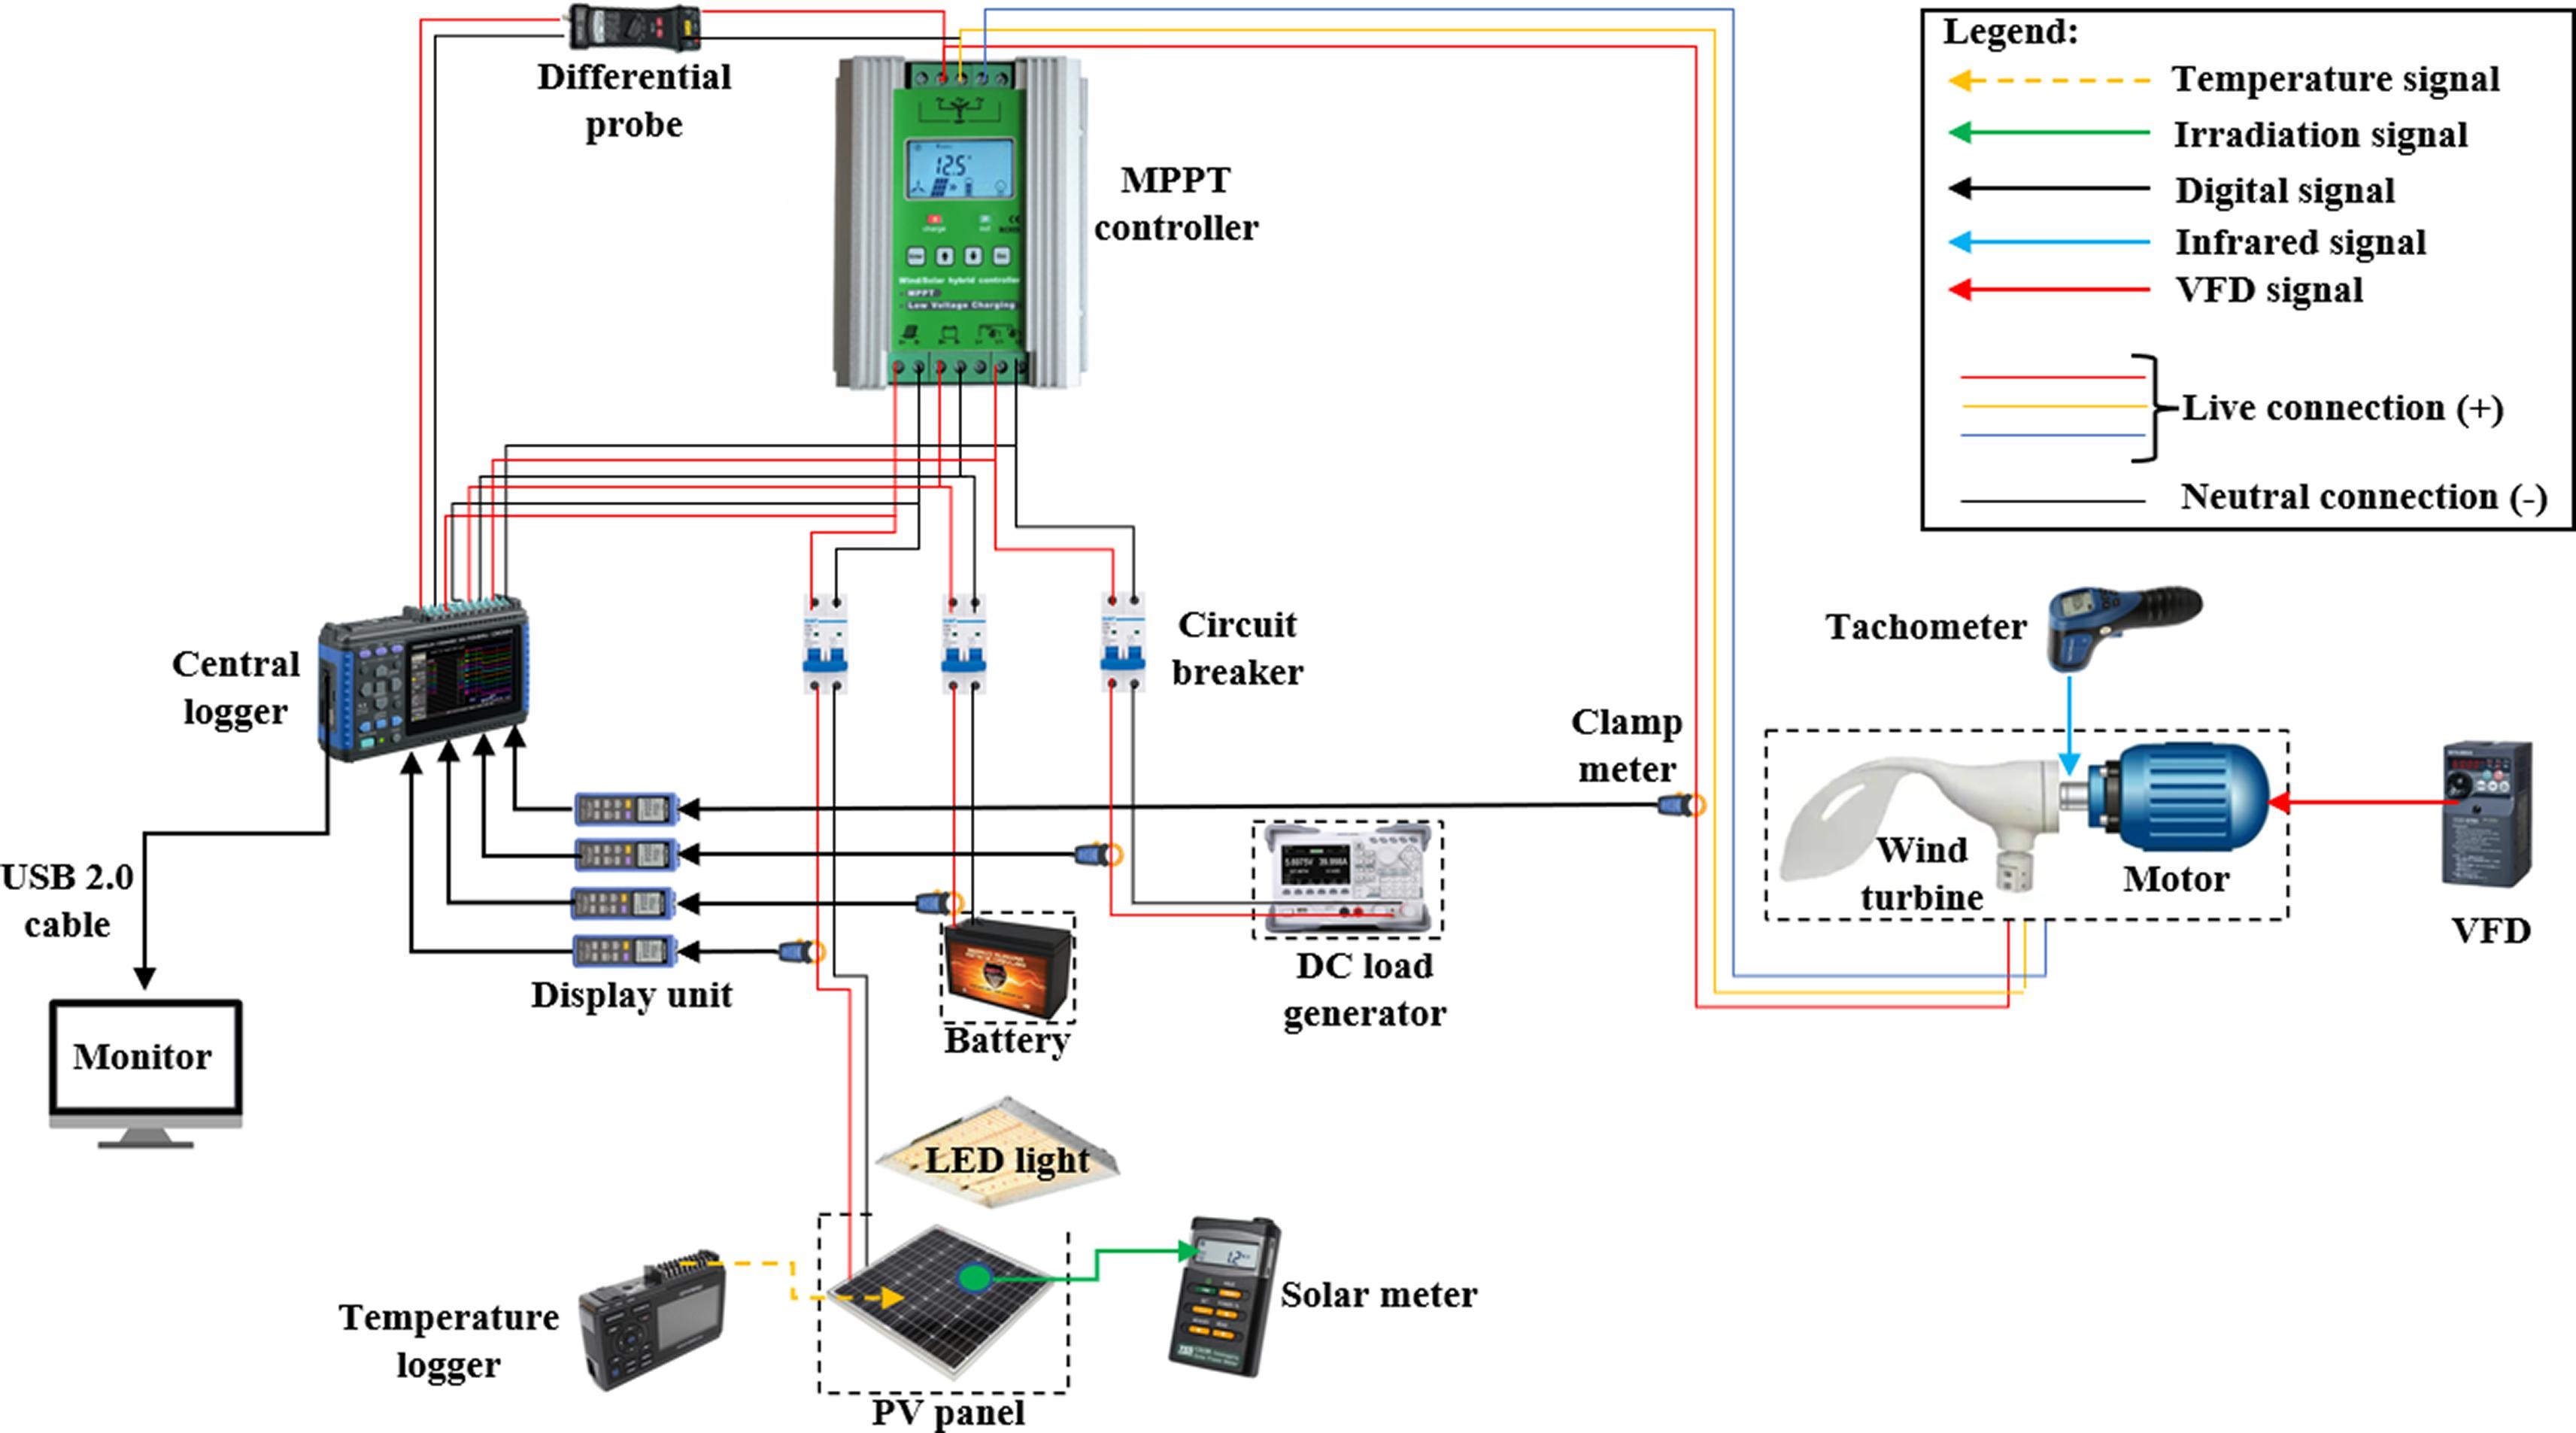
Connection schematic. Adapted from: Jacob, E., & Farzaneh, H. (2022). Dynamic modeling and experimental validation of a standalone hybrid microgrid system in Fukuoka, Japan. Energy Conversion and Management, 274, 116462.
The experimental setup is composed of the following components:
a) Photovoltaic Panel:
The PV panel, an RNG-50D-SS (RENOGY) monocrystalline solar panel rated 50W with a high efficiency grow light (TSW2000),mounted above it, whose intensity is varied with a dimmer switch calibrated from 0 to 100 in 25 intervals. The light intensity (910μmol/18in.) is 50% more photon efficient and emits most light in the 400–700nm waveband, which is the range of maximum radiation from the sun based on the solar spectrum. The light provides the necessary radiation for the PV panel. Additionally, two fans are placed side-by-side and one at the bottom of the PV panel for cooling to enhance its power output. An irradiation meter (TES-132) is connected to a lux sensor, where the latter is placed on top of the solar panel to measure the amount of light incident on it. Thermocouples are used for measuring the top and back surface temperature of the panel, which is displayed on a temperature logger (GRAPHTEC-GL240), when the system is in operation. The output PV current is measured with a clamp meter (HIOKI-CT7631) clamping around the positive output cable. The meter is then connected to a display unit (CM7290) that also functions as an analog to digital converter before the final connection to the central signal logger (HIOKI-LR8431). The output voltage is also measured and logged by the central signal logger with two cables from the PV DC disconnect breaker.
b) Wind Energy Conversion System:
A 100W horizontal axis wind turbine that uses PMSG is directly coupled to a 400W induction motor to generate rotational energy. A Mitsubishi Electric variable frequency drive (FREQDOL-D700) is used to vary the motor’s frequency (Hz), which changes its rpm. The equivalent rpm is measured with a digital tachometer (TI-900). The desired wind profile (m/s) that the wind turbine will experience is determined by the fluctuation in rpm. The current from one of the wind turbine generator’s phases is measured using a clamp meter (HIOKI-CT7631) which is connected to a display unit (CM7290) and then to the central signal logger (HIOKI-LR8431). The three-phase voltage is measured using a differential probe (P9000-02) and then connected to the central signal logger.
c) Energy Storage System:
The battery is a 12V/10Ah AGM Deep Cycle battery. A clamp meter (HIOKI-CT7631) is clamped around the positive battery output cable for current measurement, then connected to a display unit (CM7290) and finally to the central signal logger. The battery voltage is also measured and logged by the central signal logger with two cables from the battery circuit breaker.
d) Dynamic Load:
A DC load generator (RIGOL DL3021) is used to create the desired load profile to be connected to the other system components. A clamp meter (HIOKI-CT7631) is used to measure the load current from the positive input channel terminal cable while the voltage is measured and logged by the central signal logger with two cables from the load circuit breaker.
e) MPPT Controller:
To integrate all the system components (PV system, wind energy conversion system, battery storage, and load), an MPPT wind/ solar hybrid controller is used. This controller is equipped with solar reverse charging, battery reverse polarity, battery open circuit, over-voltage, over-current, overload, and lightning protection. When the wind is strong or over-voltage (maximum 14.4V for a lead acid/ Gel battery in a 12V system), the controller automatically starts the braking functionality and cuts off the circuit to protect the system. Using a USB 2.0 mini-B cable, all the component (solar PV system, wind energy conversion system, battery, and load) voltages and currents from the central signal logger (HIOKI-LR8431) are displayed on a control station monitor with HIOKI (PQ ONE) application software for analyzing the measurement data.
The indoor experimental system facilitates simulation model validation and is shown below:
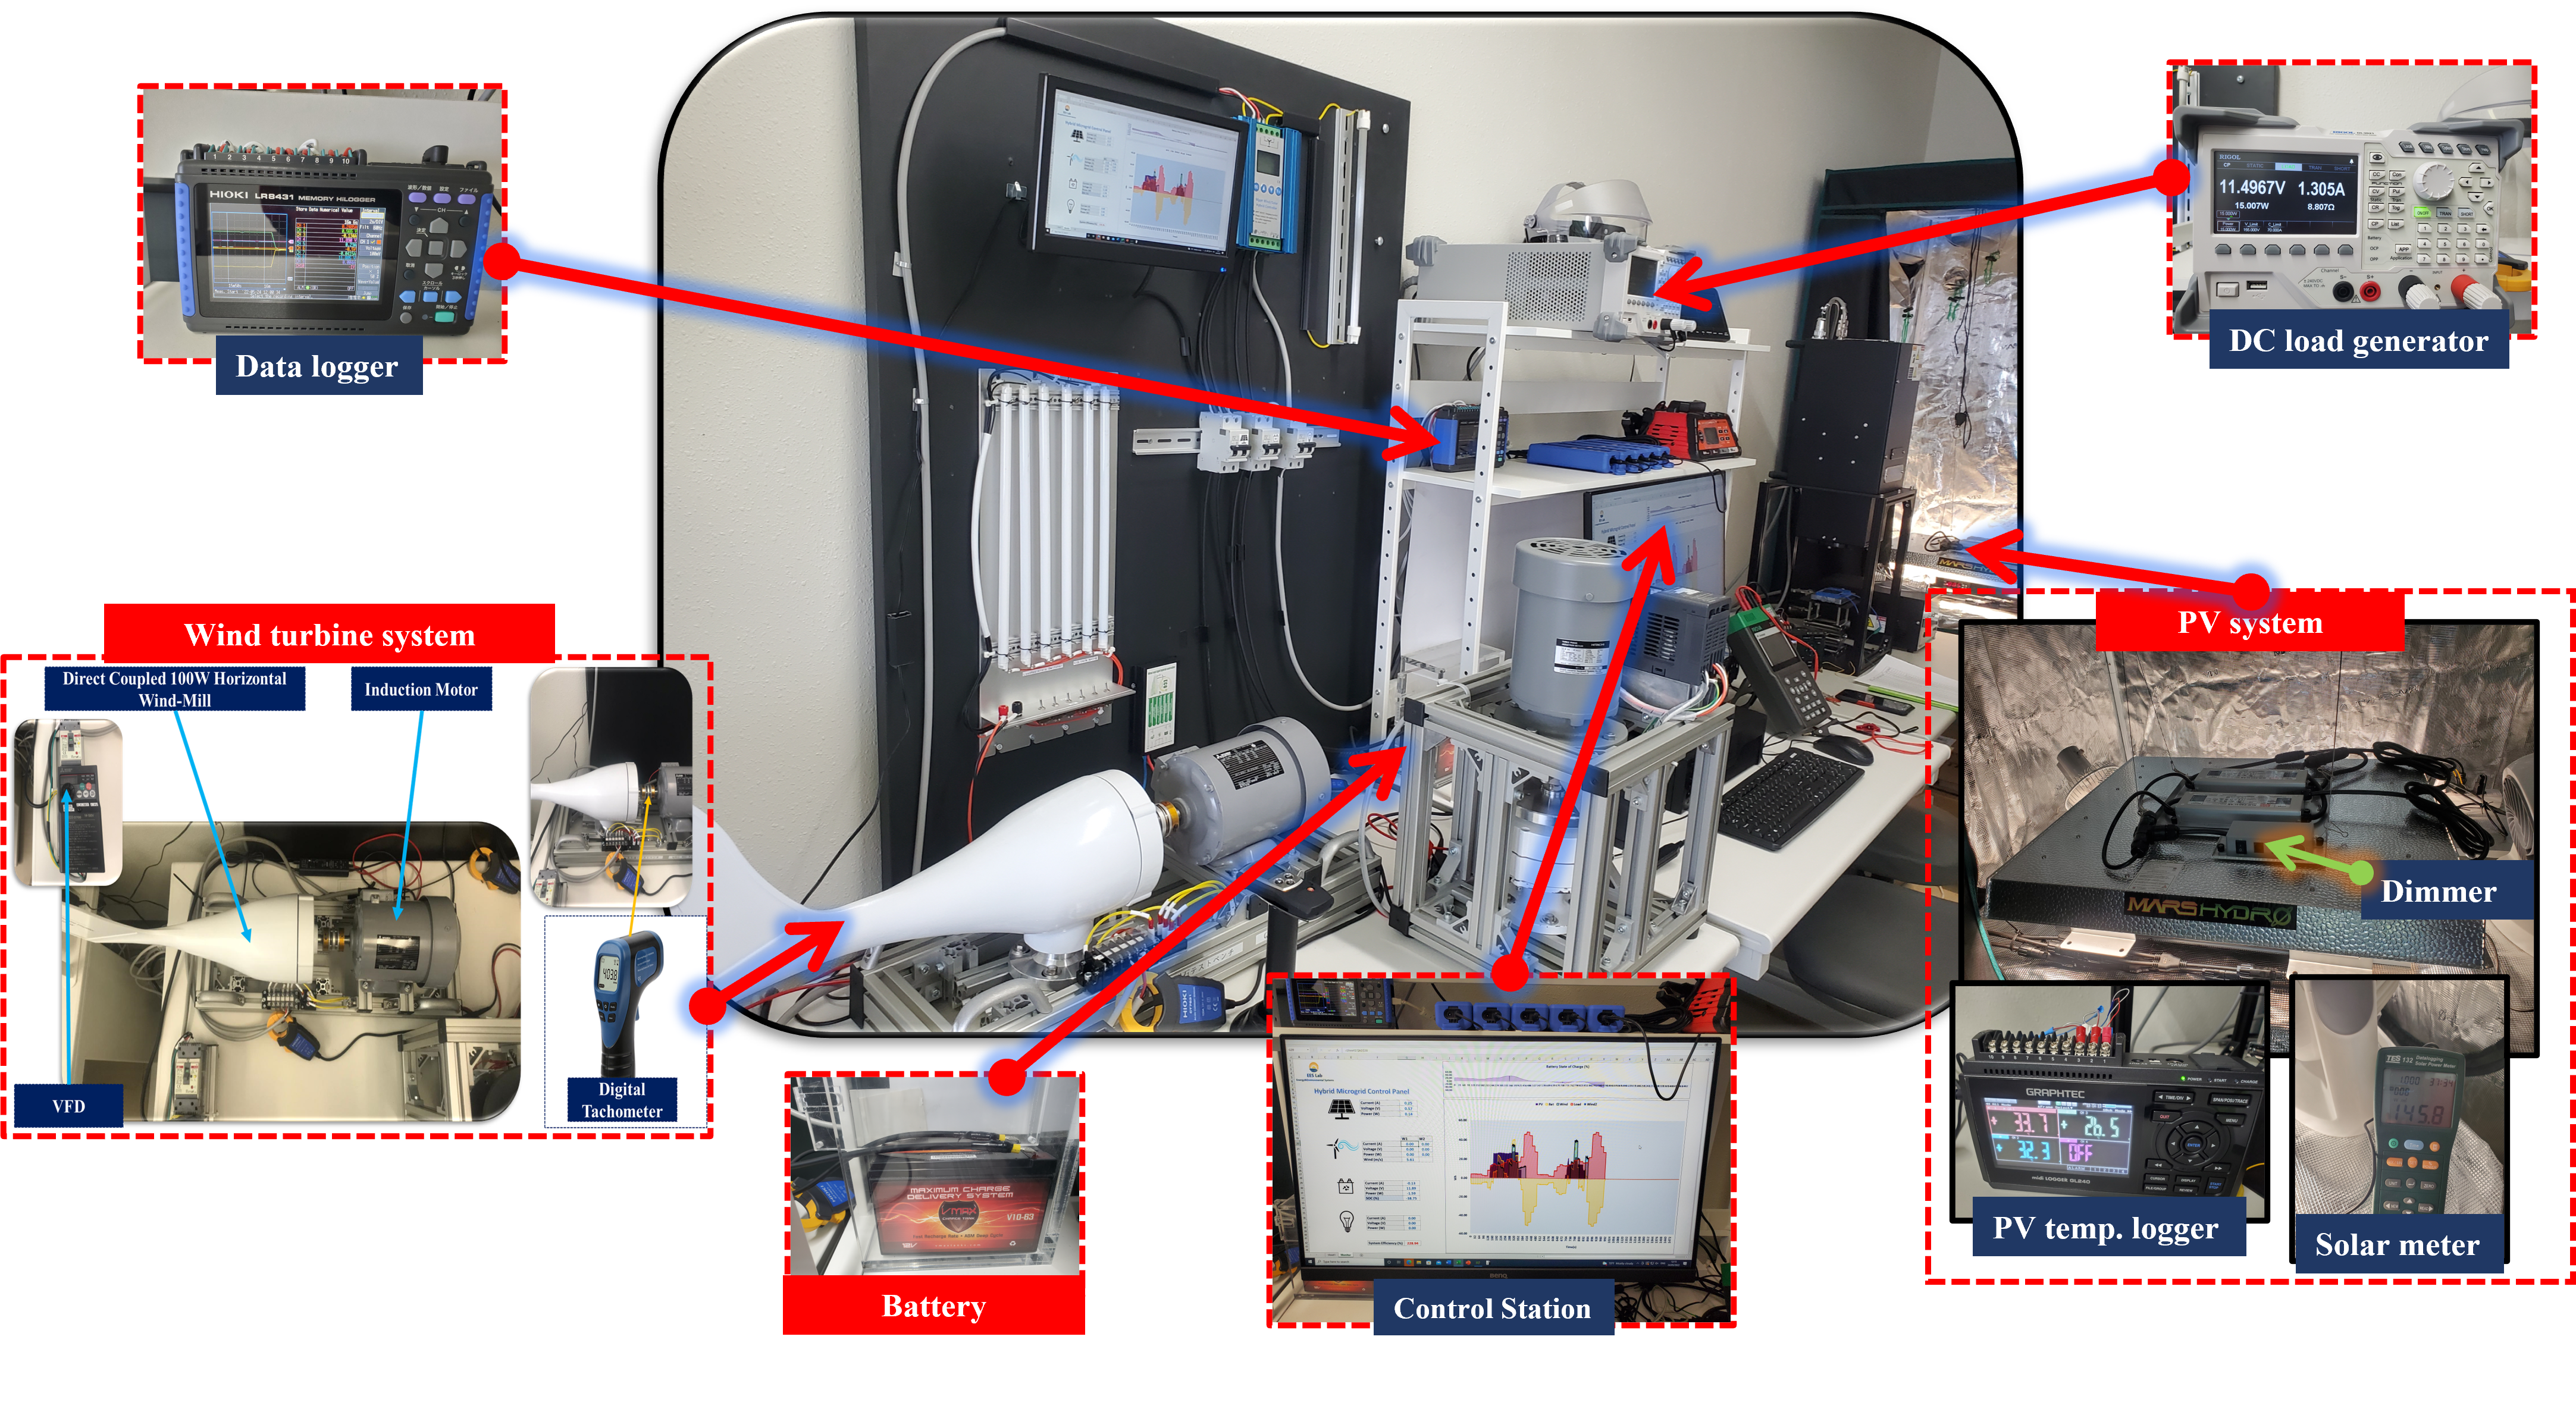
Indoor test system setup. Adapted from: Jacob, E., & Farzaneh, H. (2022). Dynamic modeling and experimental validation of a standalone hybrid microgrid system in Fukuoka, Japan. Energy Conversion and Management, 274, 116462.
2. Real-time Simulation and Testing (Speedgoat-Unit Target Machine).
In real-time simulators, to avoid overruns, the simulation internal variables and outputs must be precisely generated in the same amount of time as their physical counterparts. Furthermore, the accuracy of computations depends on the system's precise dynamic representation and the length of time used to produce results. Real-time target machines can be configured as either controllers if physical plants are available (for rapid control prototyping:-RCP), but integration requires other components like sensors and dedicated I/O modules or they can be used as digital twins of physical plants (for hardware-in-the-loop:-HiL simulation), where external industrial controllers like PLC are used to control the digital twin in the host target machine. The Speedgoat real-time simulation platform, offers unparalleled workflow integration with MATLAB/Simulink through Simulink real-time. The target machine can also be instrumented using the MATLAB App Designer and XIL-interfaced test automation software environments.
a) Hardware-in-the-Loop Simulation (HiL):
Conventional testing is typically conducted either on a dedicated laboratory testbed or directly on physical equipment. This approach can be expensive, ineffective, and even a safety hazard, although it provides testing fidelity. An excellent substitute is HiL simulation, in which a computer model that is identical to the actual plant (digital-twin) is run in real time on a simulator that is suitably outfitted with inputs and outputs (I/Os) that can interface with control systems and other equipment.
b) Rapid Control Prototyping (RCP):
RCP involves automatically importing controller mathematical models/designs, usually from MATLAB/Simulink through Simulink real-time, into a real-time simulator that has input/output (I/O) interfaces set up before the models are connected to actual systems.
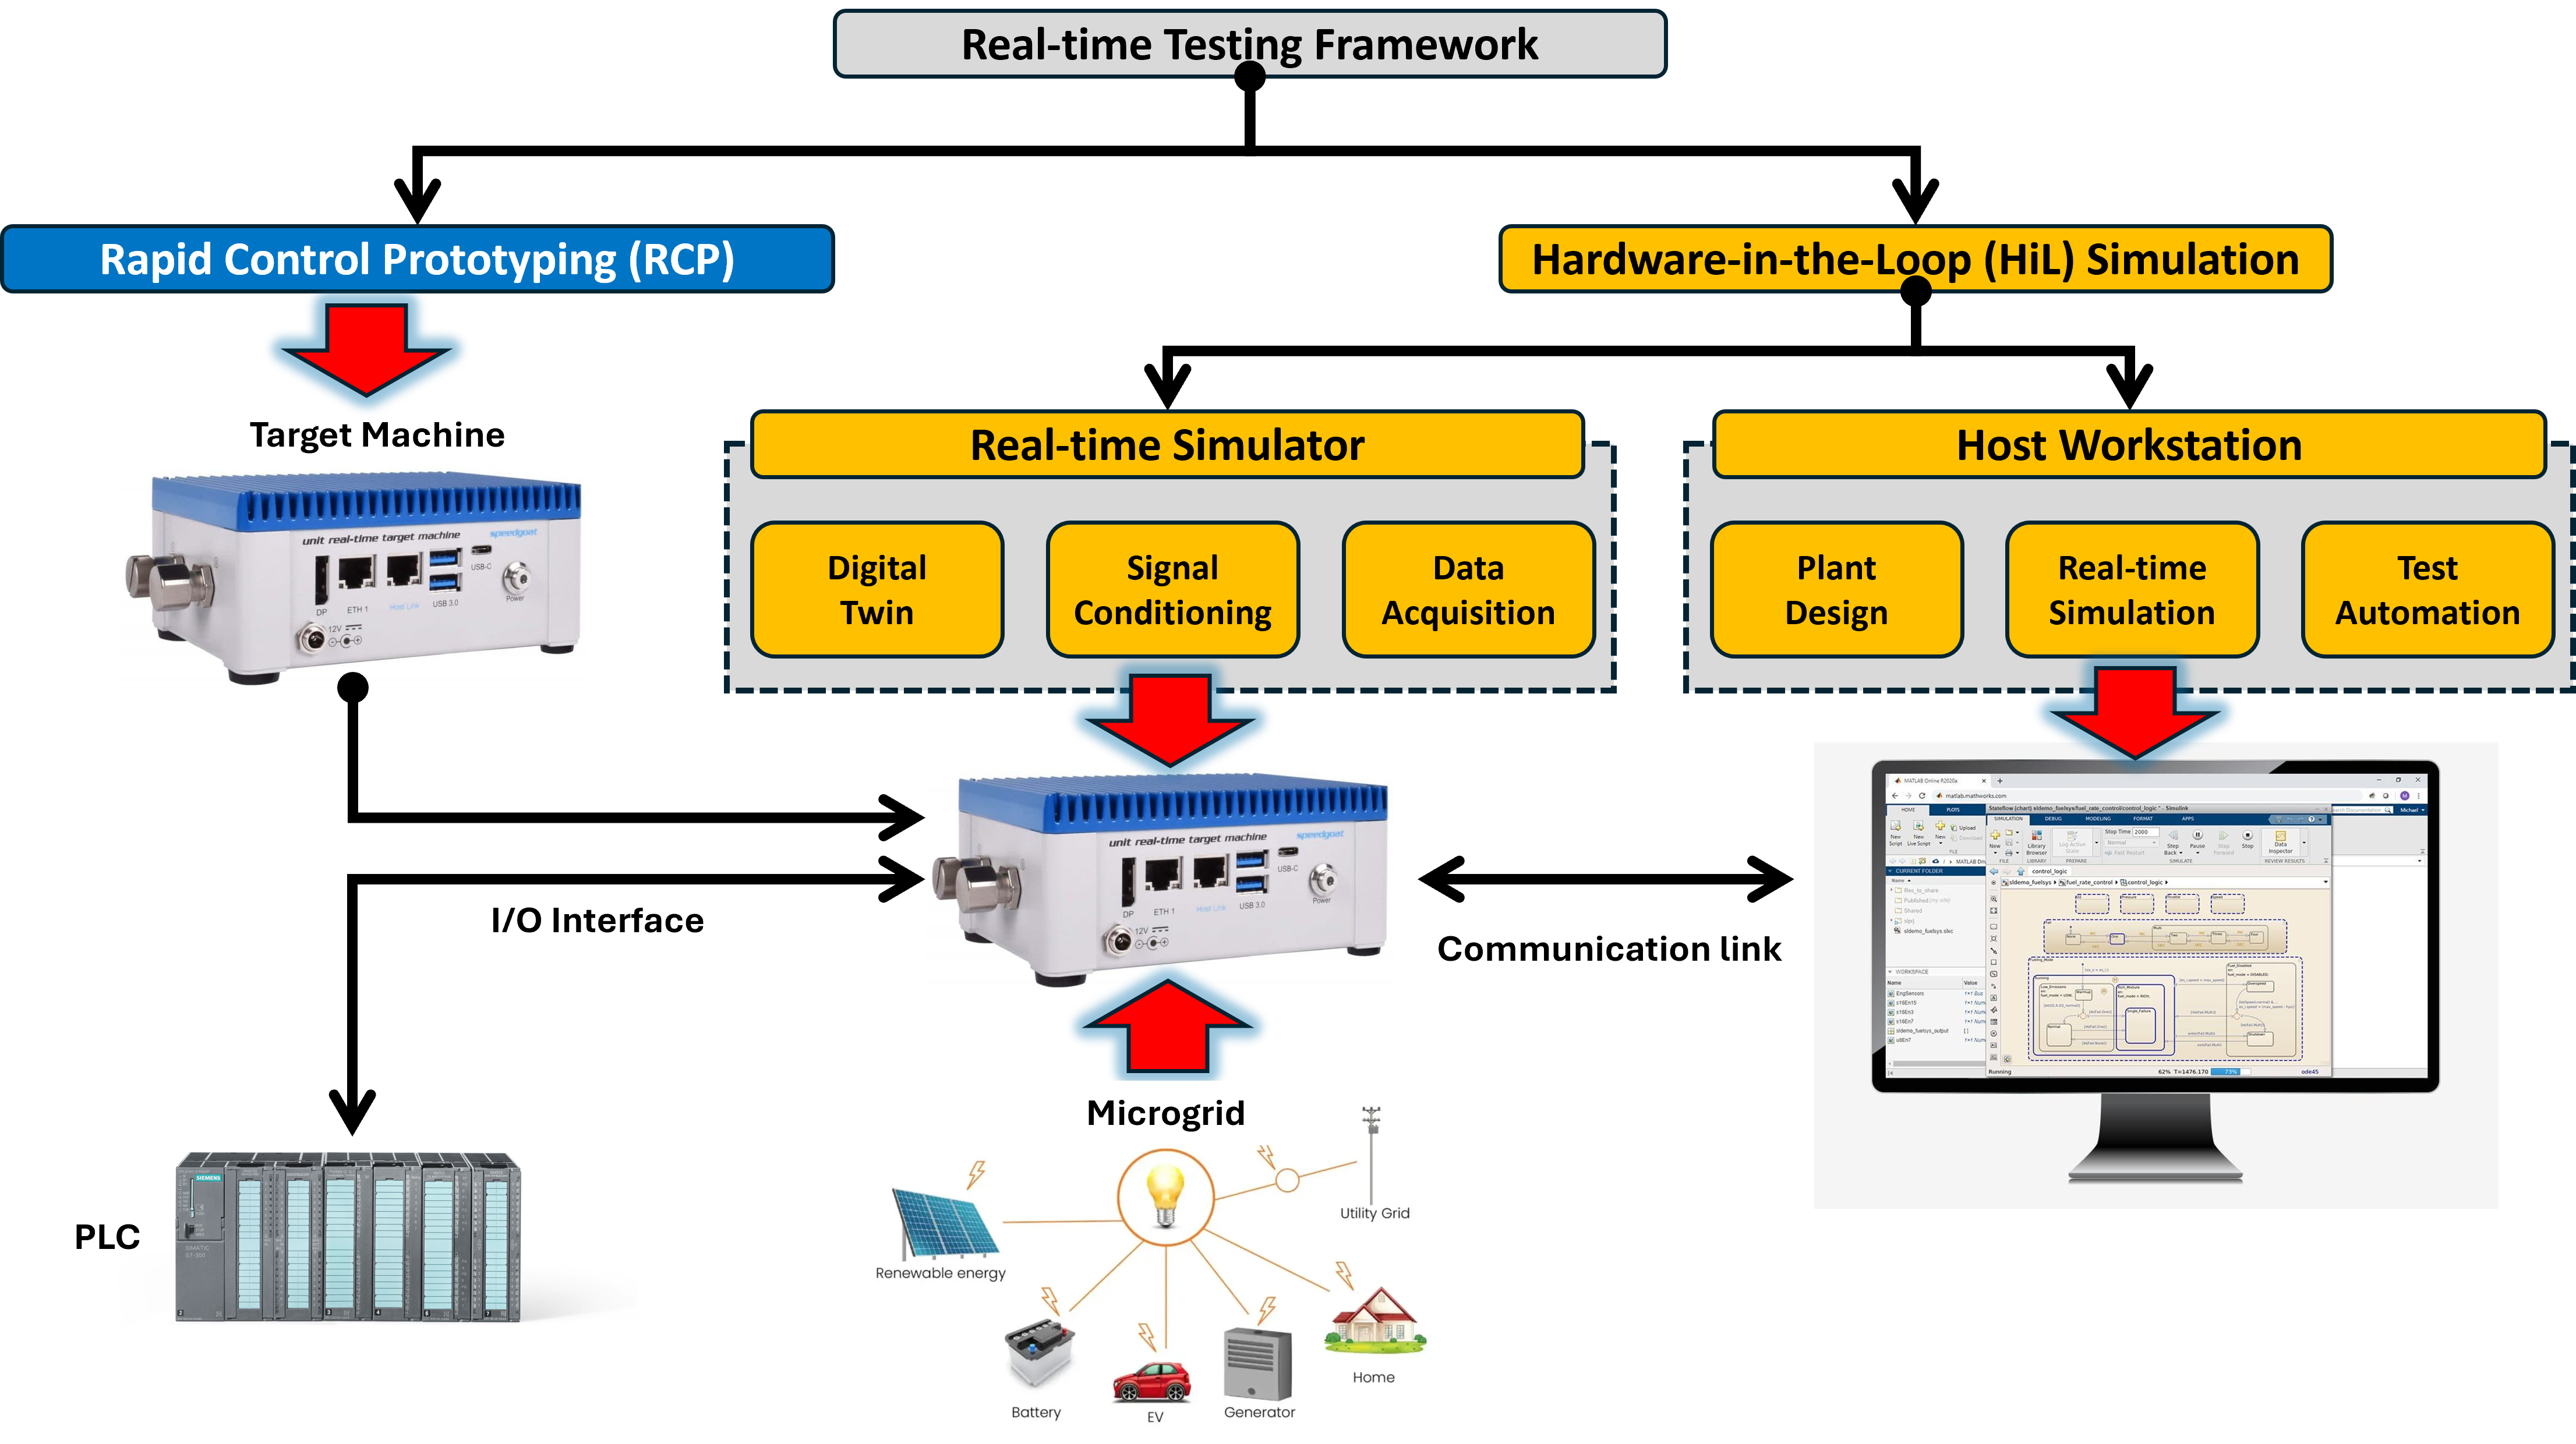
Testing workflow. Adapted from: Speedgoat.
3. All-in-one Battery Testing (Keithley 2450 SMU).
Frequently, disposable batteries are swapped out for rechargeable or secondary batteries. Ni-MH (Nickel Metal Hydride), NiCd (Nickel Cadmium), and Li-ion (Lithium Ion) are common types of rechargeable batteries. Testing the battery cycle is one method of assessing their dependability. Cycle tests reveal details about the battery's capacity, lifespan, and internal chemistry. An electronic load, voltmeter, ammeter, and programmable power supply are frequently used in a standard battery discharge/charge test. A typical device that can simultaneously monitor voltage and current as well as source and sink current is the 2450 SMU, which makes battery testing easier. Because of this, it can source current to charge the battery, dissipate power to drain the battery, and monitor bus readings (load current and battery voltage) while the test is running. It can also show these data simultaneously on its user interface along with the completed test duration. Based on the 4-quadrant operation, the 2450 SMU can either output ±210V @ ±105mA or ±21V @ ±1.05A. This is shown in the figure below.
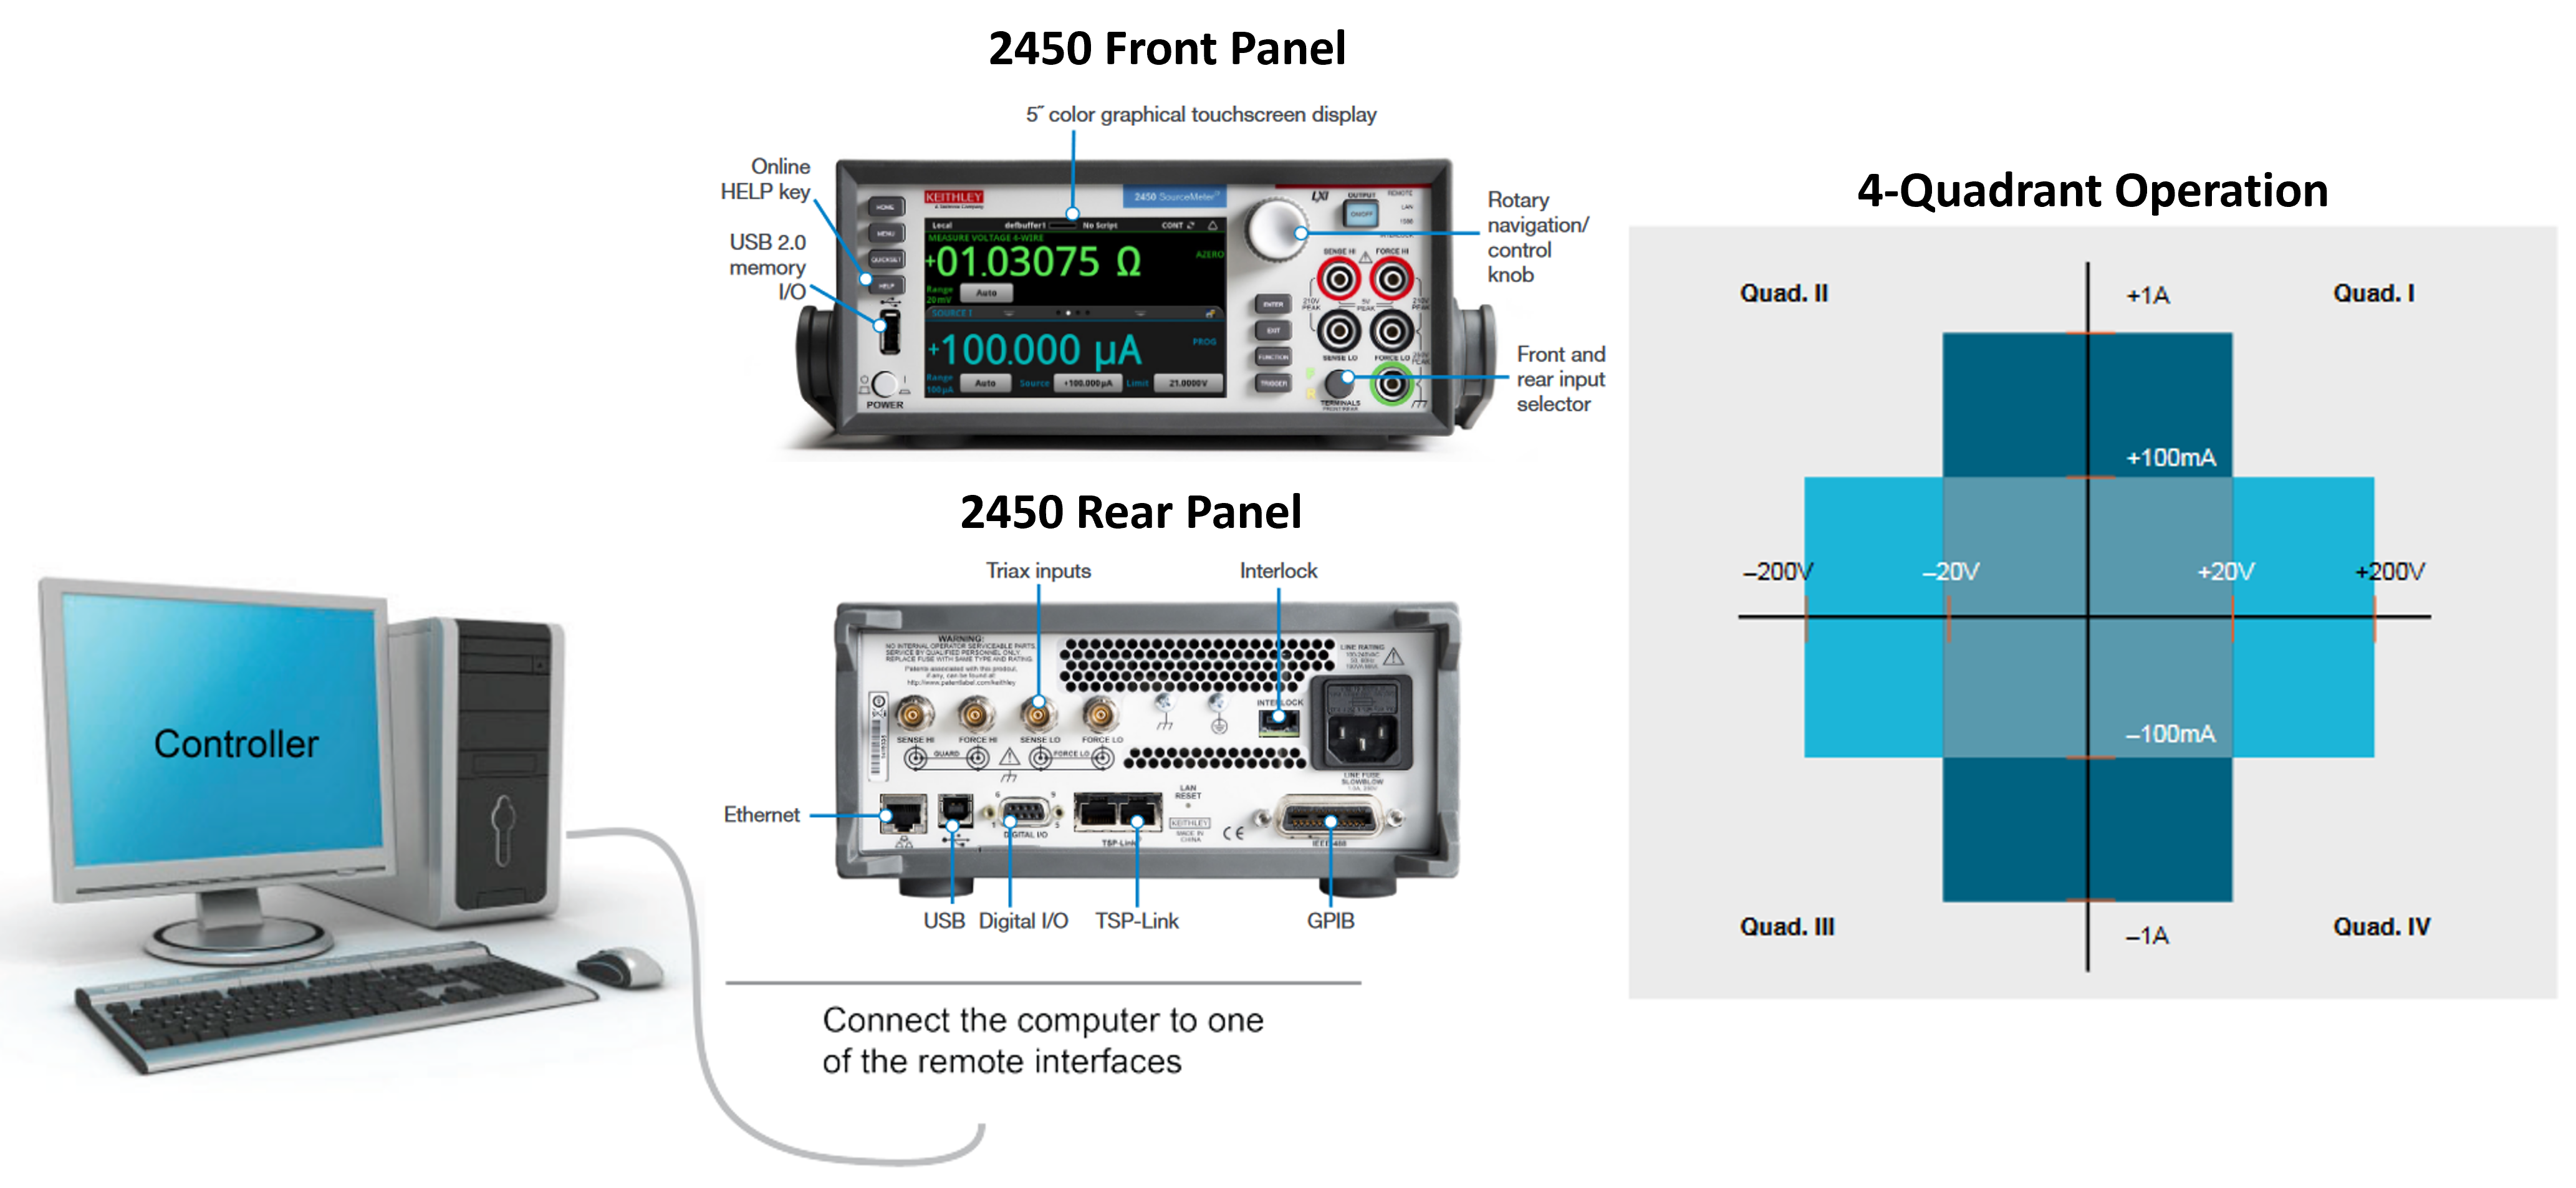
2450 SMU power envelope. Adapted from: Tektronix.
Experimental Application:
a) Rechargeable battery cycling test (charge/discharge):
The 2450 is set up to source voltage and measure current during either charging or discharging. Circuit diagram visualizations and device connections for both cycles are simplified below.
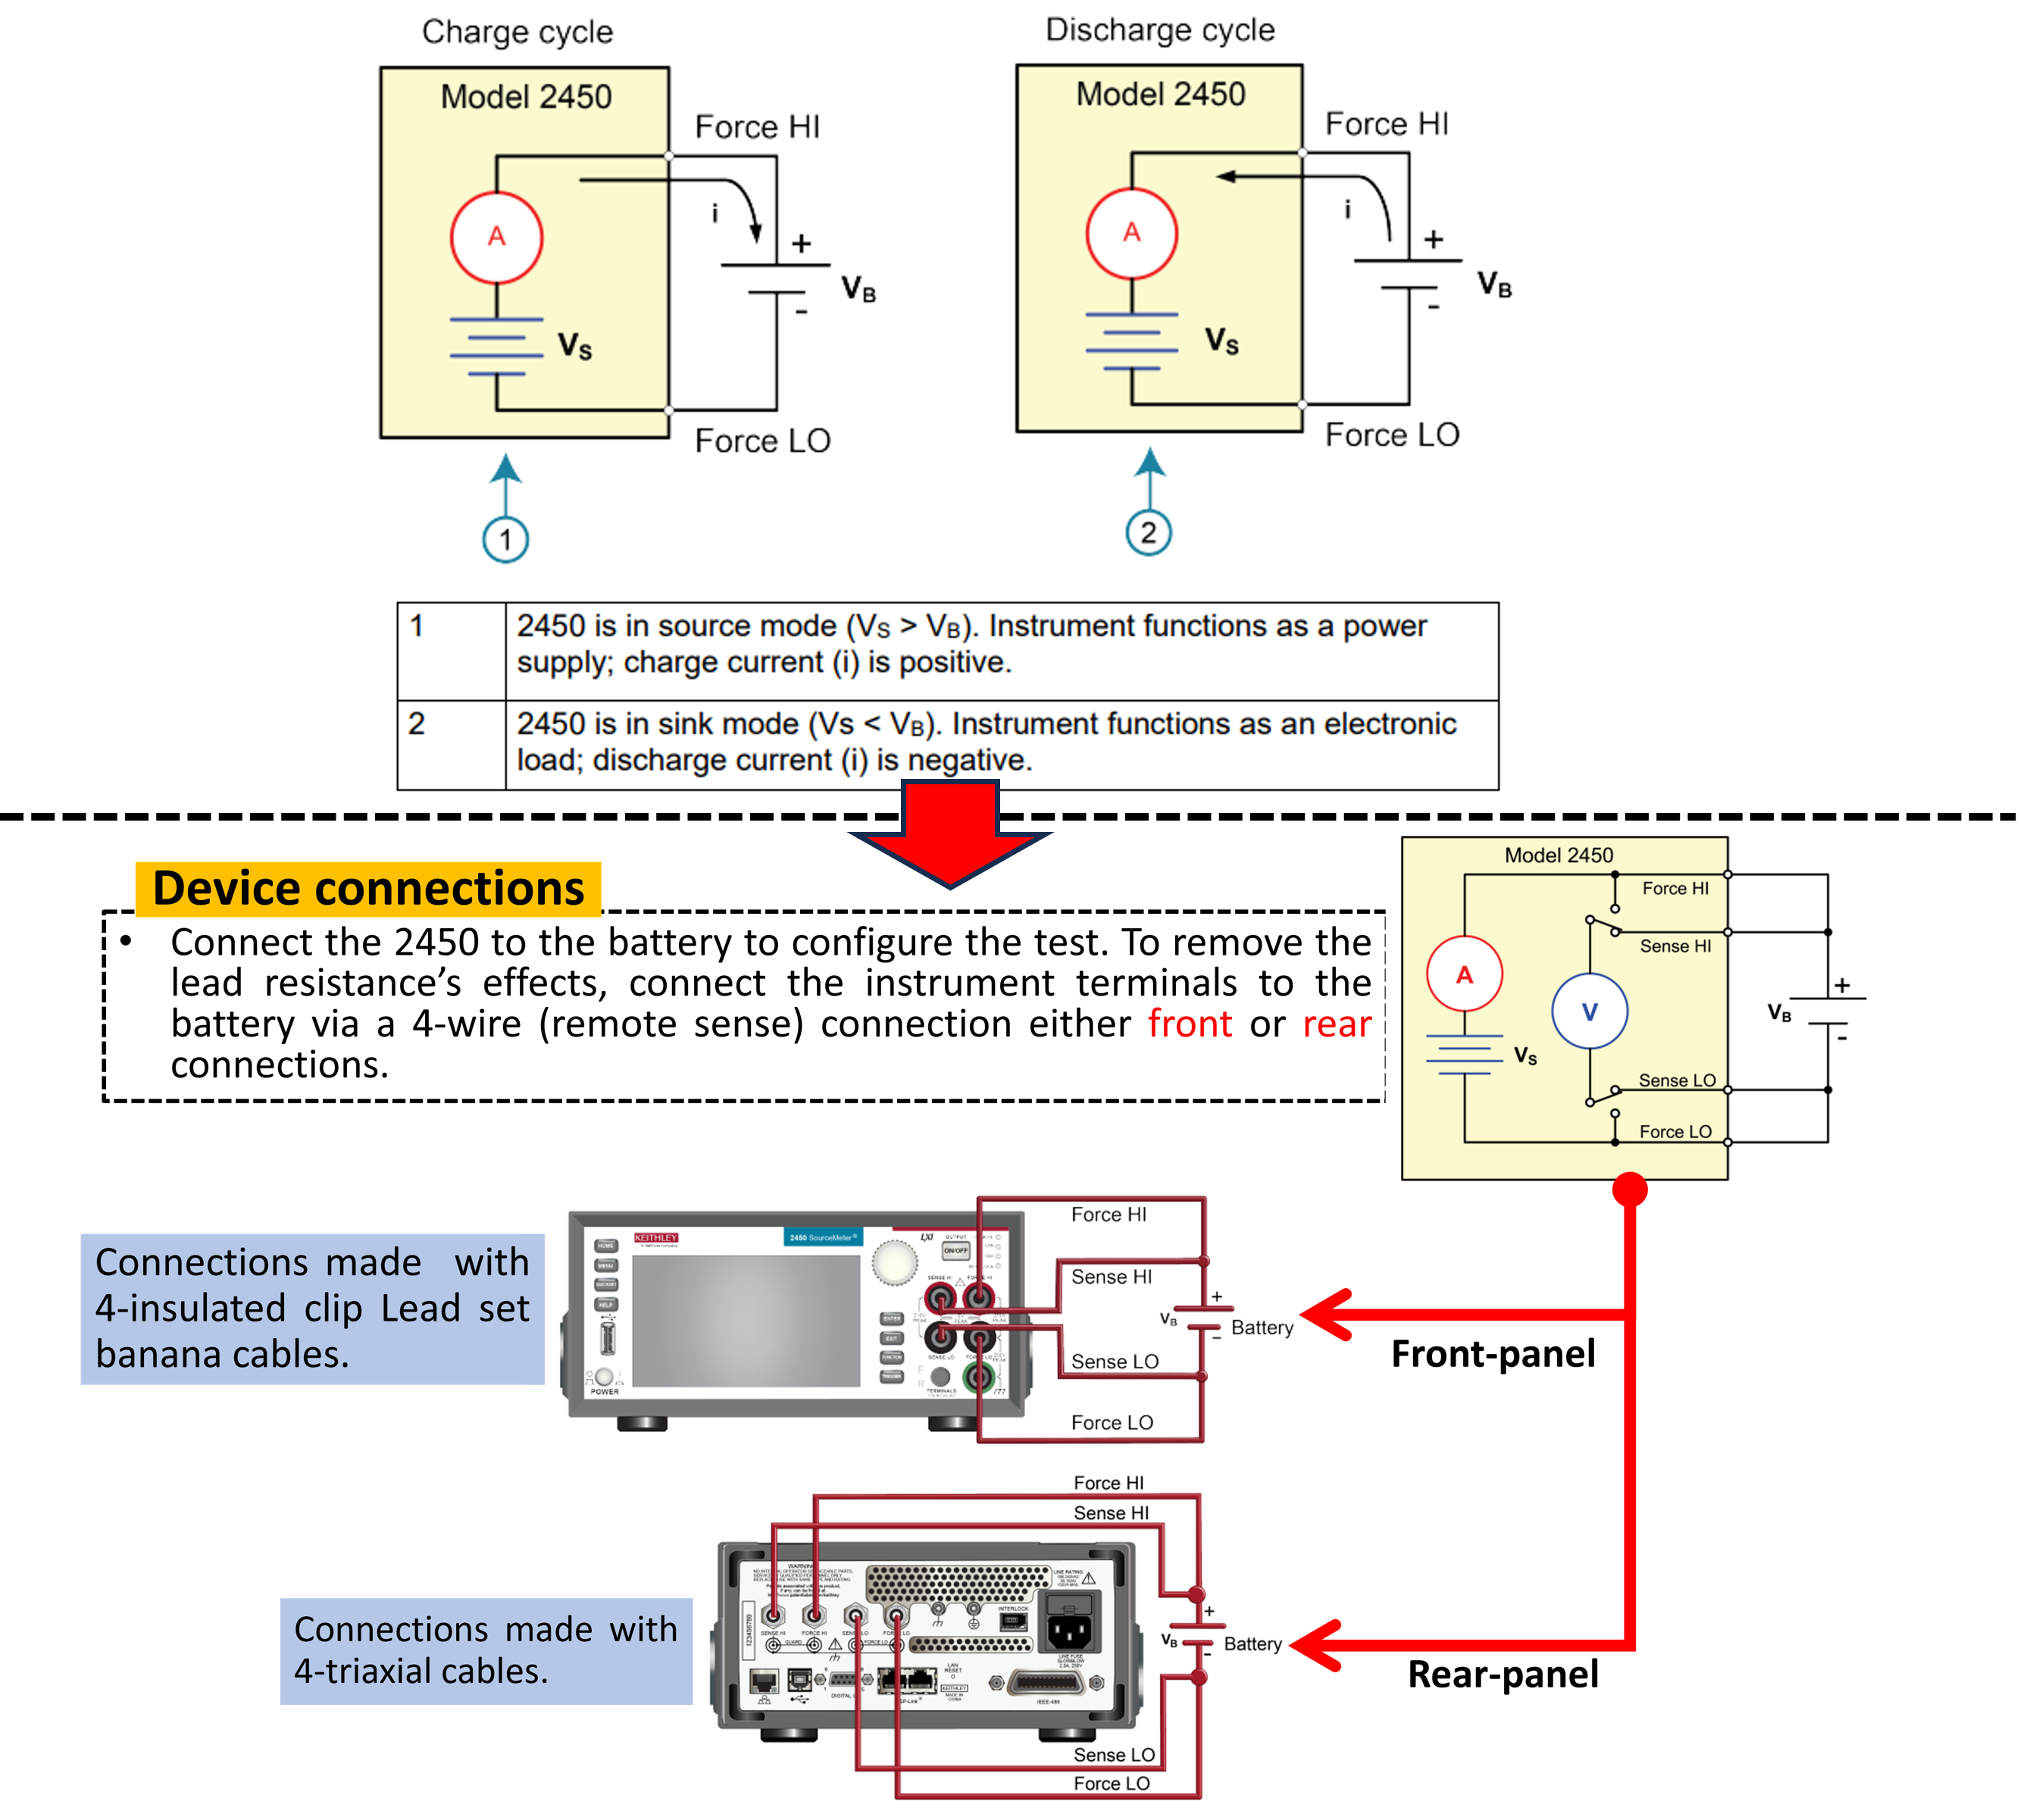
Battery cycle test circuit and 2450 SMU connection. Adapted from: Model 2450 SourceMeter ® Instrument User's Manual.
i) Charging.
Typically, a steady current is used to charge batteries. To accomplish this, the 2450 SMU is used as a voltage source that is adjusted to the battery's voltage rating and that has the intended charging current set as the current limit. The battery voltage is lower at the beginning of the test than the 2450's voltage output preset. Consequently, this voltage differential produces a current that is instantly restricted to the current limit set by the user. When the 2450 is in current limit, it functions as a continuous source of current until the voltage level is configured. The current drops until it hits zero or very close to zero as the battery gets completely charged.
ii) Discharging.
The 2450 acts as a sink when a battery is being discharged since it is consuming power rather than producing it. The 2450's voltage source is configured to be lower than the voltage of the battery. The discharge rate is determined by the current limit. The battery's current enters the 2450's HI terminal when the output is activated. The present readings are negative as a result. Until the battery voltage drops to the 2450 voltage source value, the discharge current ought to remain constant.
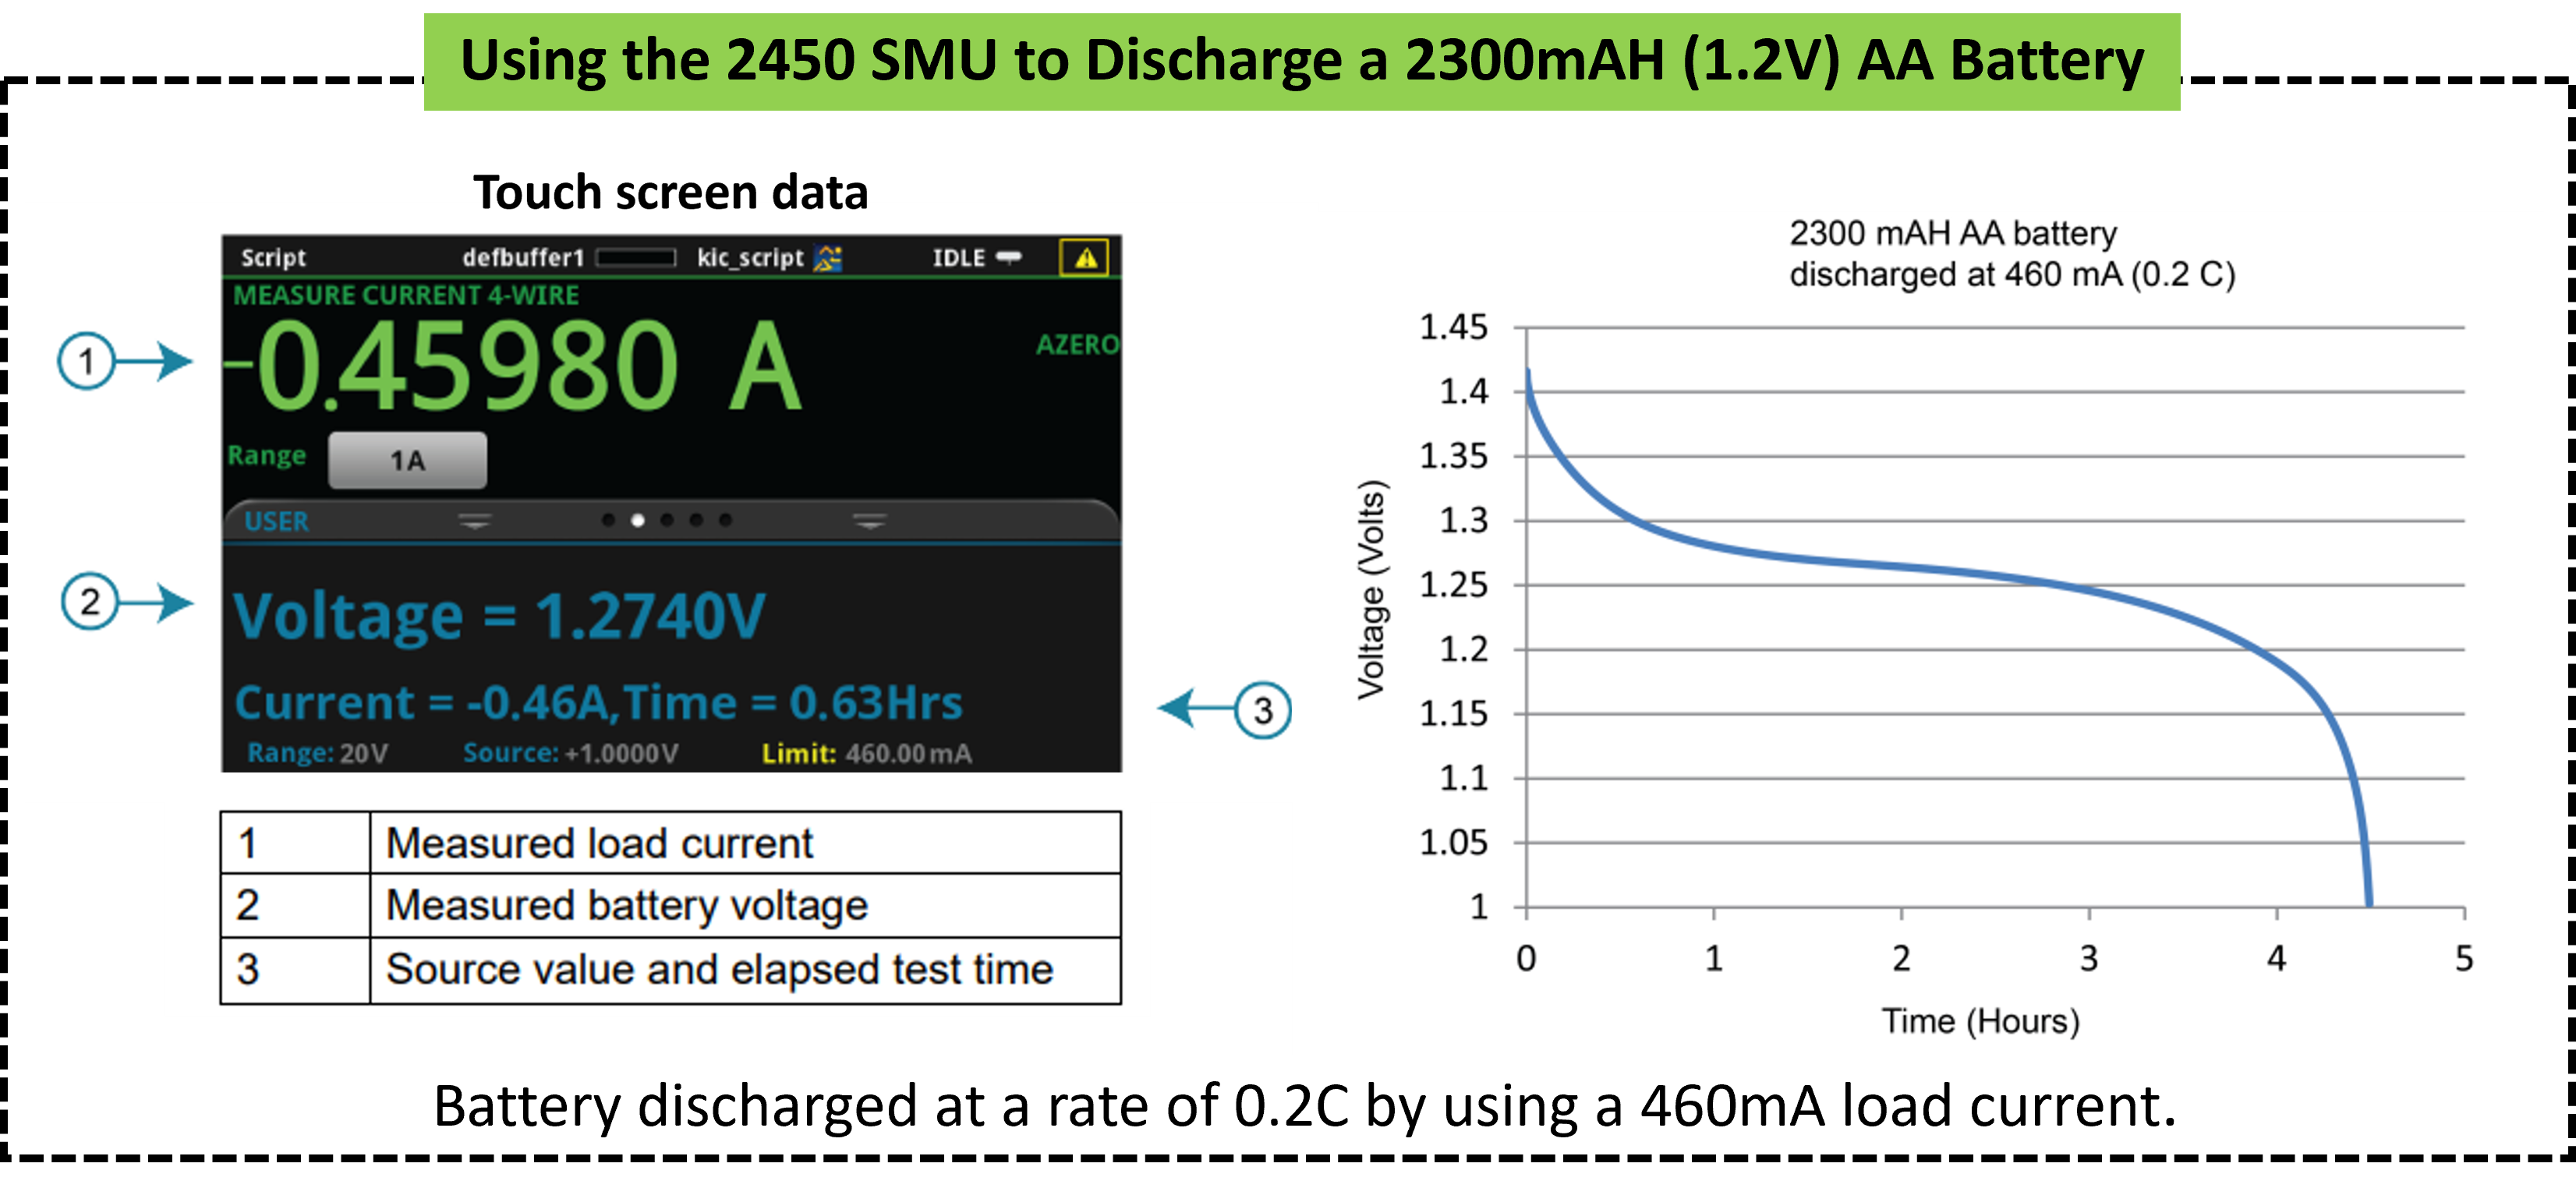
2300mAh (1.2V) battery discharge test. Adapted from: Model 2450 SourceMeter ® Instrument User's Manual.
b) KickStart:
Using 2400 Graphical Touchscreen series SMUs, the KickStart Software Battery Simulator App offers additional battery cycle capabilities and source measure unit (SMU) support, enabling battery simulation and model production in a one box solution. By automating the collecting of millions of readings, KickStart Software saves time and facilitates data visualization.
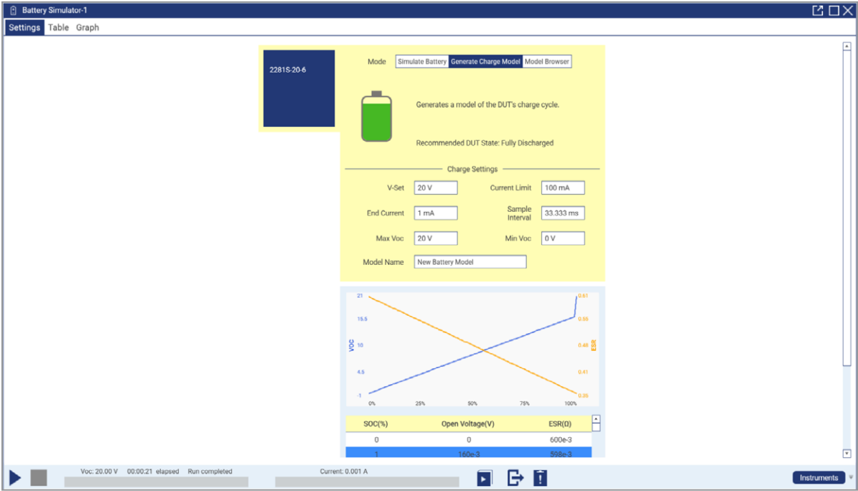
KickStart Software User Interface. Adapted from: KickStart Data sheet.
By including SMUs in the KickStart Software Battery Simulator App, a more comprehensive range of batteries may be tested in conjunction with a potent "one-box" solution. With KickStart Software, testing can be easily repeated in a variety of scenarios and a straightforward process for creating battery models for simulation may be employed. The app's capability is further expanded with the addition of battery charge/discharge and cycle testing.